Module 3: The Nitrogen Cycle
Created 01/03/2023 - Last updated 23/05/2024
IMPORTANT NOTE: It is highly recommended that you upgrade your APSIM Next Gen version to at least version 2023.2.7164.0 or later.
The Nitrogen Cycle
In this exercise you will observe the cycle of fertiliser nitrogen in a fallow situation; urea to ammonium, ammonium to nitrate and the loss of soil nitrate via denitrification. This simulation will introduce editing a simple Manager rule and demonstrate more advanced features of graphing simulation results.
- Start a new simulation based on the
Wheatexample. - Rename this simulation to Nitrogen Cycle.
- Save this file as
Module3. - The simulation will use a different weather file. To do this:
- click the
weathernode - click the
browsebutton - double-click
AU_Dalby(C:\Program Files\APSIM[Version]\Examples\WeatherFiles)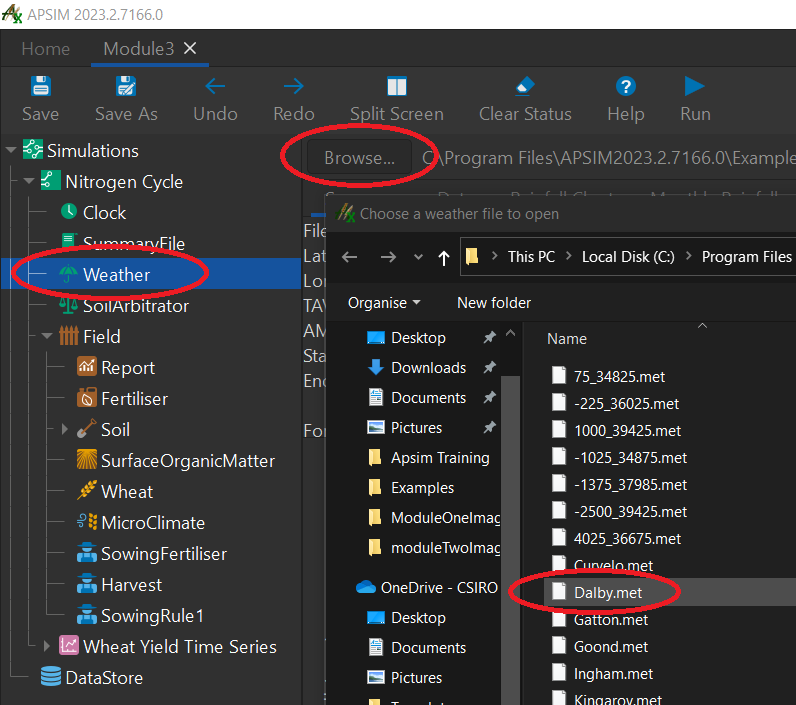
- click the
- In the
Clocknode, change the starting date to1/1/1989and the end date to31/12/1989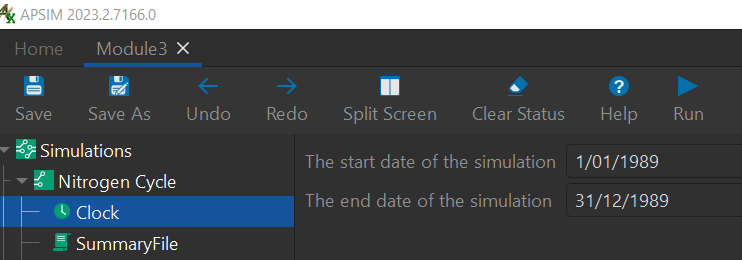
- Add the
Heavy Claysoil from theTraining toolbox - Delete
Soilnode - Set
Percent fullto 50 in theHeavy Clay'sWaternode.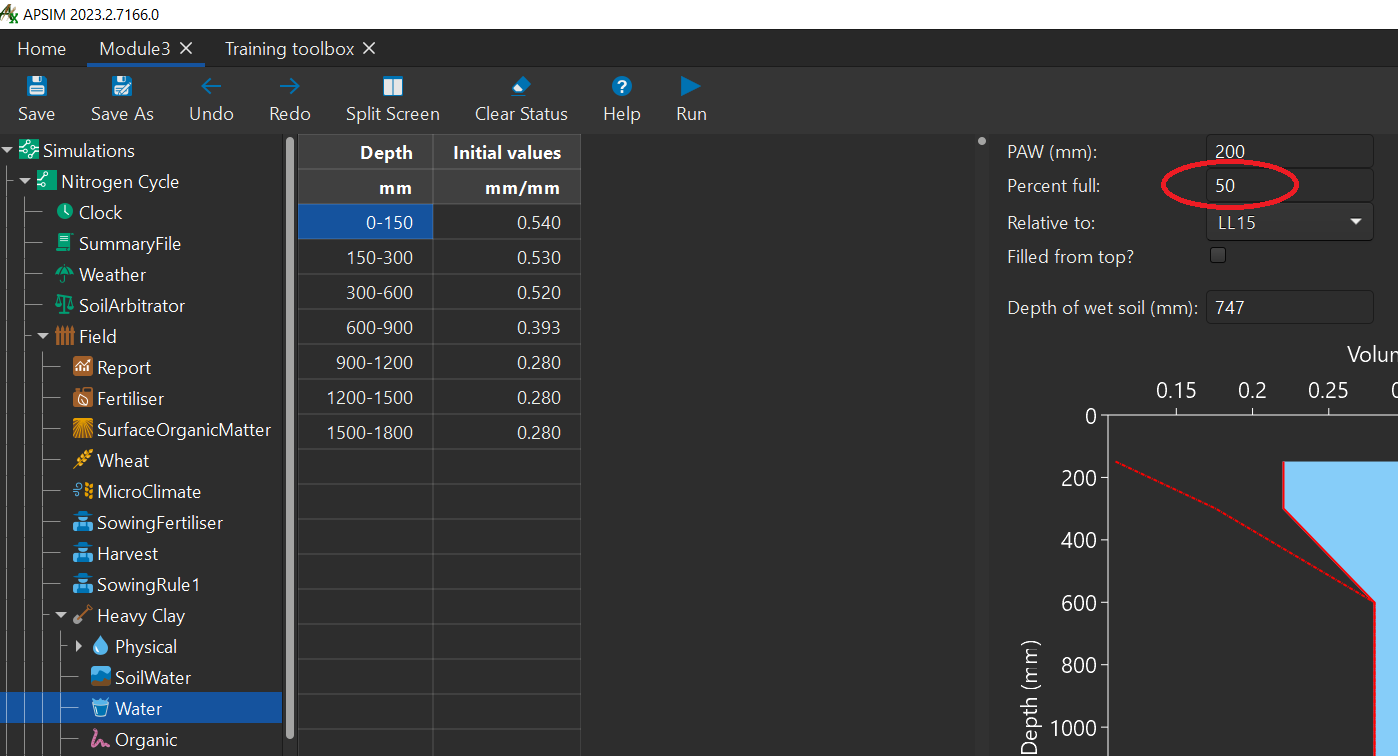
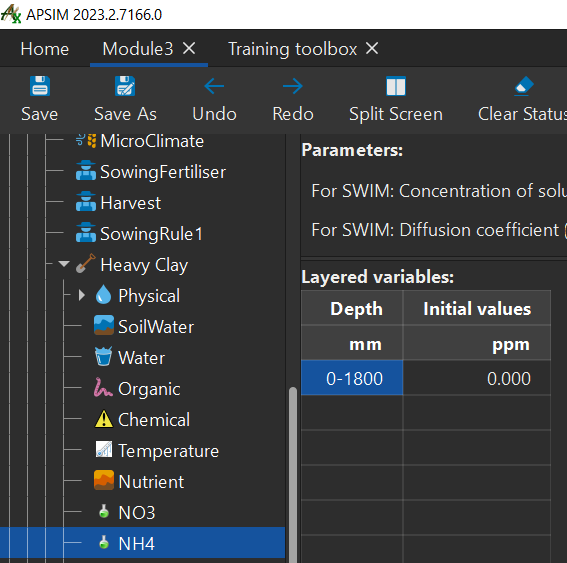
- Set starting nitrogen to 19kg/ha NO3 and 0 NH4, evenly distributed. Don’t forget to change units to kg/ha (right-click the column header
ppm). Make the depth equal to the entire soil profile (check Water node for the profile depth).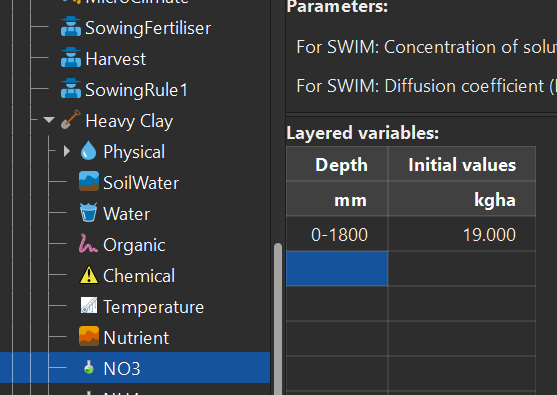
- Delete all manager scripts (all have a farmer icon: SowingFertiliser, Harvest, SowingRule1)
- Copy a
Fertilise on fixed datesmanagement node to the field node. You can locate this by going to:- Home
- Management toolbox
- Fertilise folder
- You can either drag this to your
Fieldnode or copy and paste it to theFieldnode.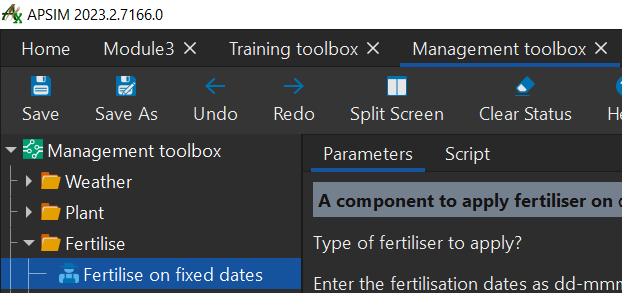
- Change
Type of fertiliser to apply?toUreaN - Change fertilisation date to
10-Jan - Change
Amount of fertiliser to be applied (kg/ha)to100 In the
Reportnode let set up the output variables:[Clock].Today [Weather].Rain [Soil].SoilWater.Drainage sum([Soil].SoilWater.ESW) sum([Soil].NO3.kgha) as NO3Total sum([Soil].NH4.kgha) as NH4Total sum([Soil].Nutrient.DenitrifiedN) as DenitrificationIn the
Report eventssection remove existing event variables. Then add:[Clock].EndOfDayRun the simulation
Delete the current graph named
Wheat Yield Time SeriesAdd another
Graphnode to theNitrogen Cyclesimulation nodeRename
GraphtoNitrogenAdd a
SeriestoNitrogengraphRename
SeriestoNO3 total- Variables for this
Series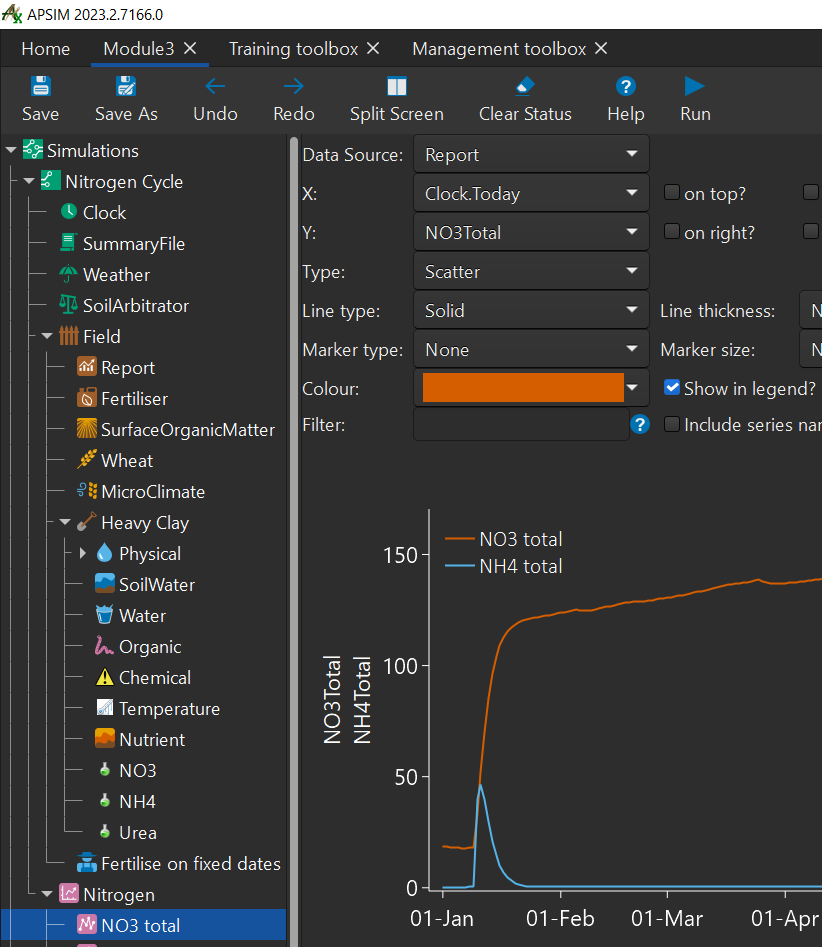
- Variables for this
Add another
Seriesnode toNitrogenRename this
SeriestoNH4 total- Variables for this
Series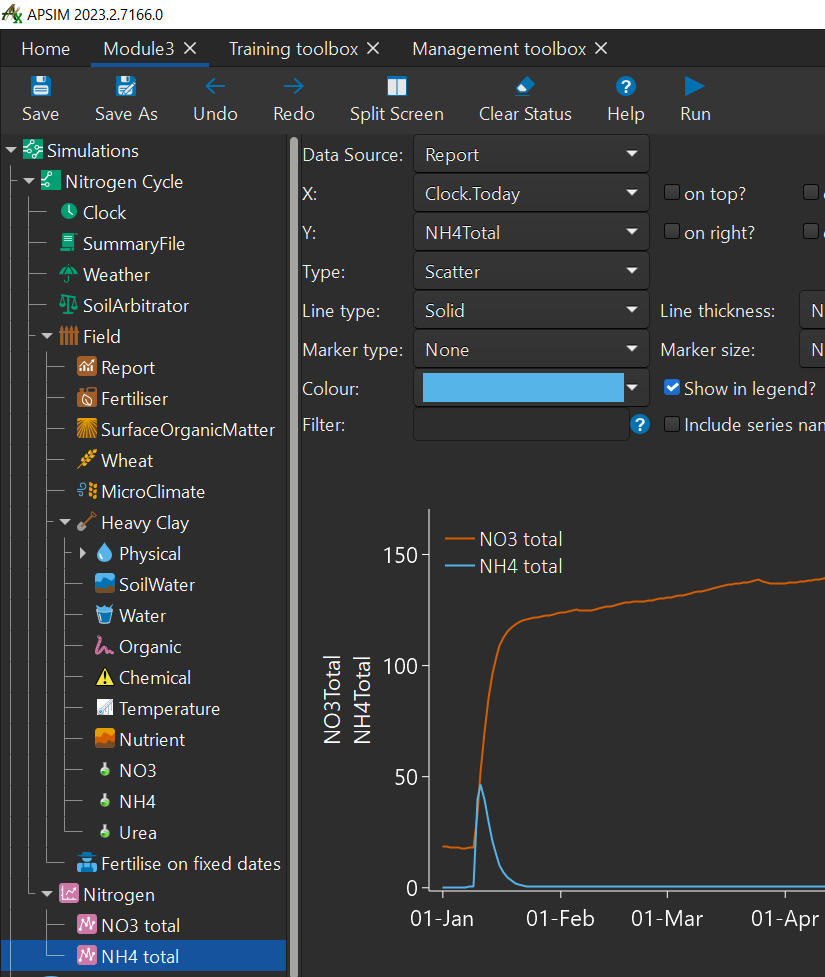
- Variables for this
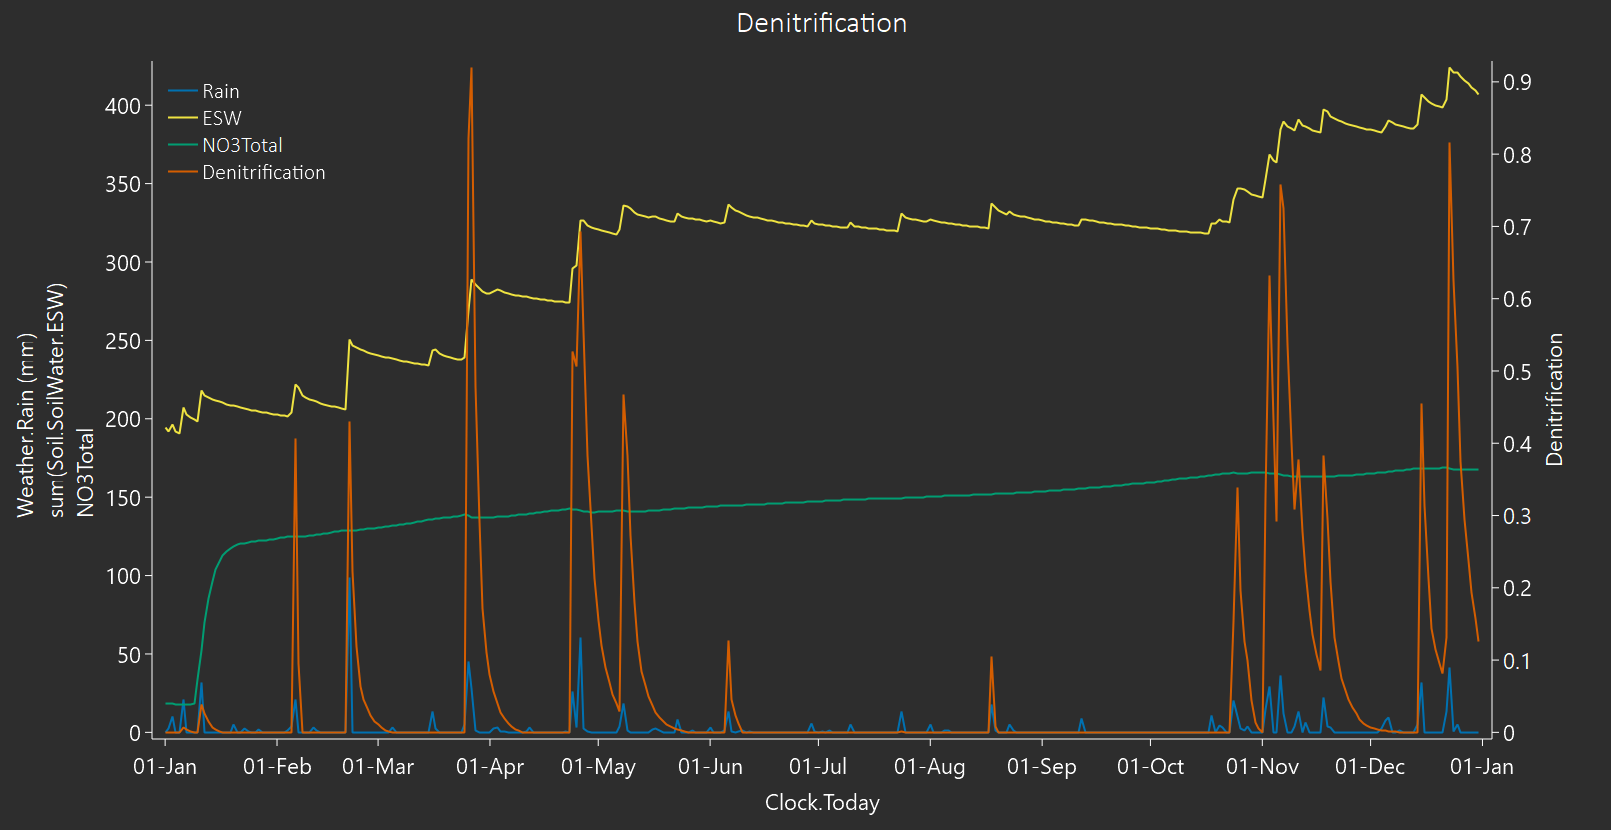
Create a new graph with a series each for
rain,sum([Soil].SoilWater.ESW),NO3Total,Denitrification.- each series should have
[Clock].Todayas theXaxis variable.
- each series should have
From this chart you can see that significant nitrogen is lost via denitrification when large amounts of nitrate are available in saturated soil conditions.
Congratulations on finishing the 3rd module!
Note: If you found any incorrect/outdated information in this tutorial, please let us know on GitHub by submitting an issue.