Module 2: Surface Organic Matter Simulation
Created 23/02/2023 - Last updated 05/03/2023
IMPORTANT NOTE: It is highly recommended that you upgrade your APSIM Next Gen version to at least version 2023.2.7164.0 or later.
The Effect of Residue Cover on Soil Water Storage during Fallow
Tracking the Decline of Cover as Residues Decompose.
APSIM simulates the influence of crop residues on the efficiency with which water is captured and retained during fallows. Residue cover declines as residues decompose. Residue decomposition is simulated in APSIM in response to weather, as well as the chemical composition of the residues. By doing this simulation you will reinforce skills learned in previous exercises and learn to do some basic editing of default values to “customise” your simulations.
This module assumes you have completed the previous module: “Module One: Fallow Simulation”. It will introduce you to the Surface Organic Matter module and demonstrate how surface residue decomposes over time.
For this module we will use the simulation we created in Exercise 1 (Module1) as a base. There is also a completed example in the training toolbox if you would prefer to use that. Open the file Module1.apsim.
Save the file as Module2.apsim in your
Apsim Trainingfolder. Remember to useSave AsnotSaveor you will overwrite the old file.Delete the
Sand Fallowsimulation. We’ll useClay Fallowas the starting point. Also delete the graph.Make a copy of
Clay Fallowby dragging it to the simulations node in the tree and rename this new simulation toClay Residue.- Your node tree should look like this:
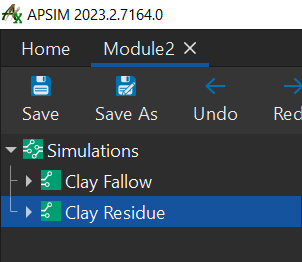
- Your node tree should look like this:
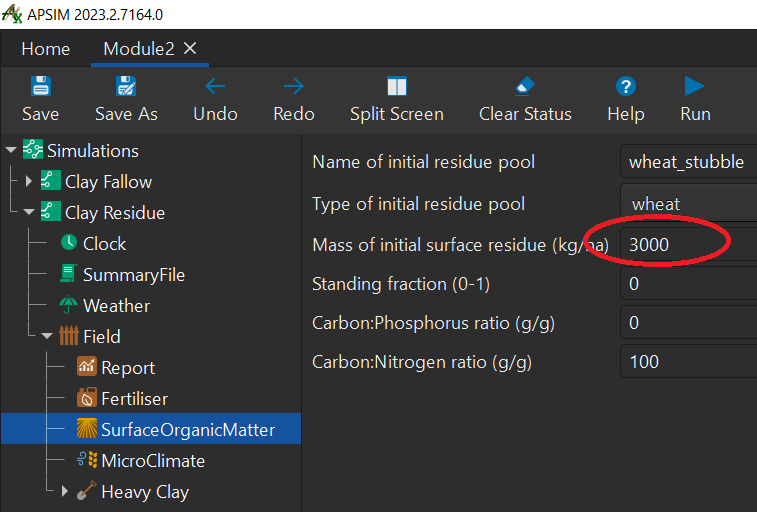
Expand the new simulation then expand the paddock node. Click the SurfaceOrganicMatter module and change the initial surface residue to 3000 kg/ha.
Run both of the simulations, either by clicking on the
simulationsnode at the top and then clicking Run, or selecting them individually and running them.Create a graph of Date vs surface organic matter cover (SurfaceOrganicMatter.Cover) and Weather.Rain (right hand axis) for the
Clay Residuesimulation.- To do this:
- right-click
Clay Residuenode. - change graph name to
Organic Matter Cover - right-click
Organic Matter Covernode,- double-click
Add model..., - double-click
Series
- double-click
- click
Seriesnode- change
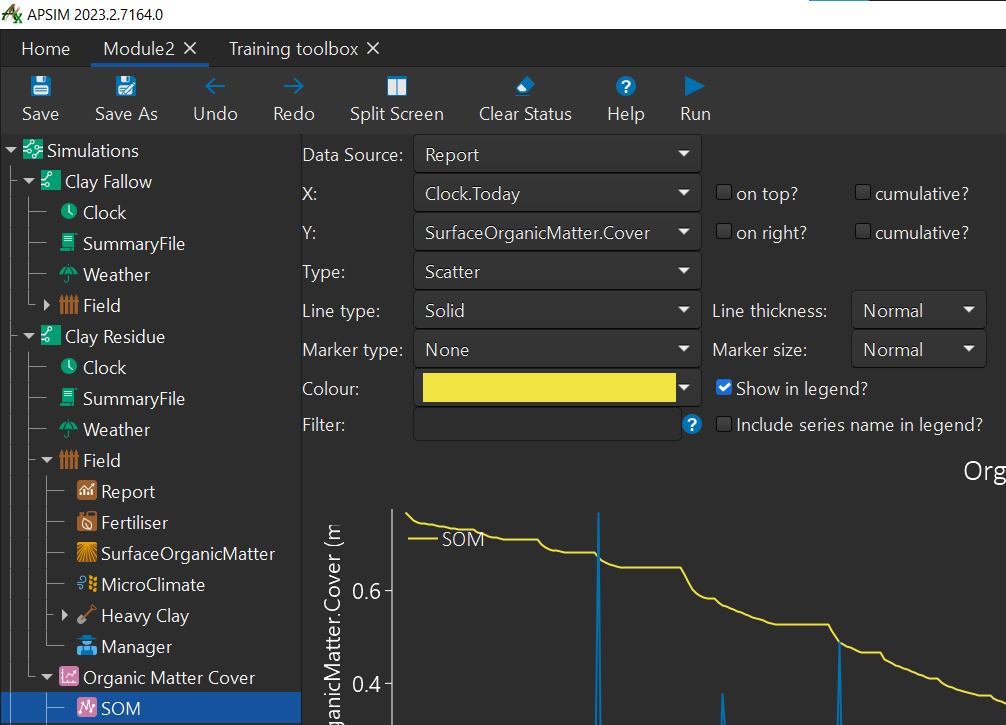
XtoClock.Today - change
YtoSurfaceOrganicMatter.Cover - select
Reportas data source - change the
typetoScatter - change
line typetoSolid - change
marker typetoNone - change
colourto yellow - rename this
Seriesnode asSOM.
- change
- Your node tree should look like this:
- right-click
- To do this:
Create another series for rain under the
Graphnode.- To do this:
- right-click
Organic Matter Covernode- double-click
Add model... - double-click
Series - rename this series to
Rain
- double-click
- click
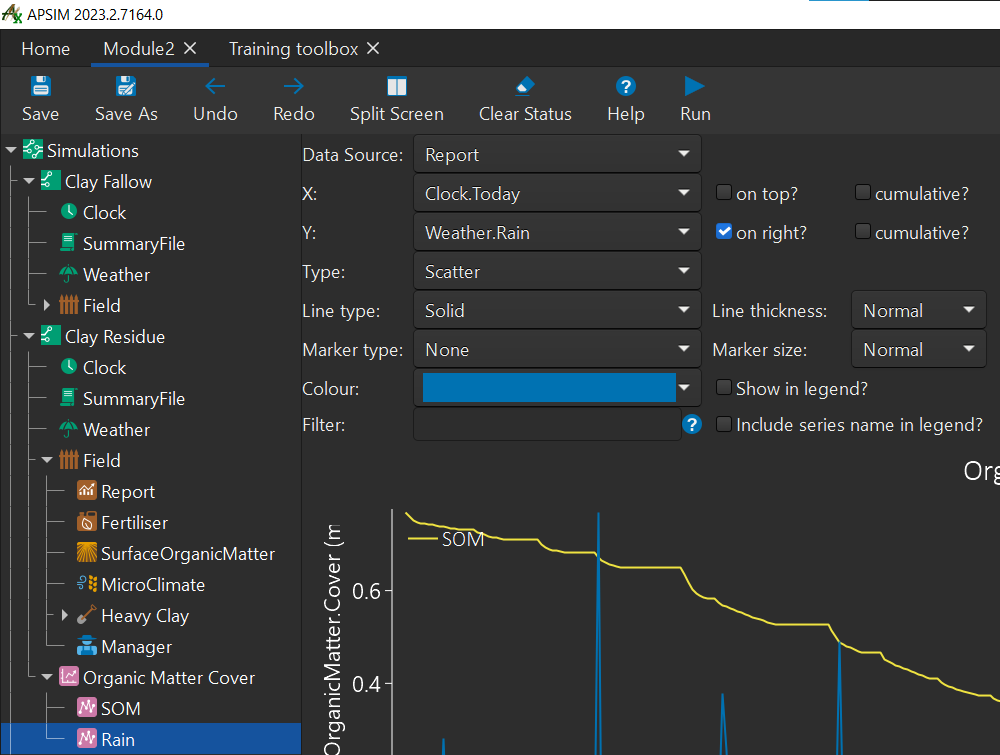
Rainnode- select
ReportforData Source - change
XtoClock.Today - change
YtoWeather.Rain- check
on right?checkbox
- check
- change
TypetoScatter - change
Line typetoSolid - change
Marker typetoNone - change
Colourto blue.
- select
- Your node tree should look like this:
- right-click
- To do this:
The effect of cover decline on runoff and evaporation
We will compare the effect that ground cover has on runoff.
- Graph both simulations, with Date vs runoff (cumulative) and Rain (right axis).
- To do this:
- right-click the
Simulationsnode - click
add model... - double-click
Graph
- right-click the
- To do this:
- Rename the graph to Runoff.
Let’s build the graph
- To do this:
- right-click
Runoffgraph - click
Add model... - double-click
Series - rename series to
Cumulative Runoff - Set your series variables to below:
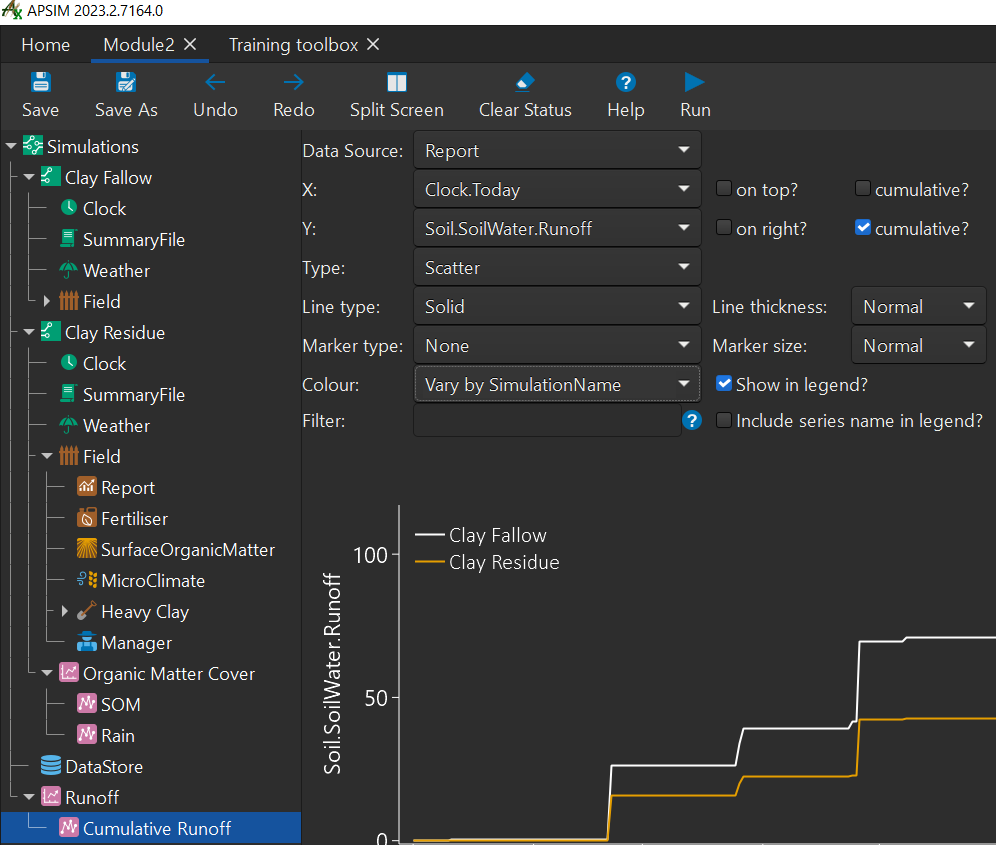
- NOTE: If you only get one graph it means that one simulation has not been run yet.
- right-click
- To do this:
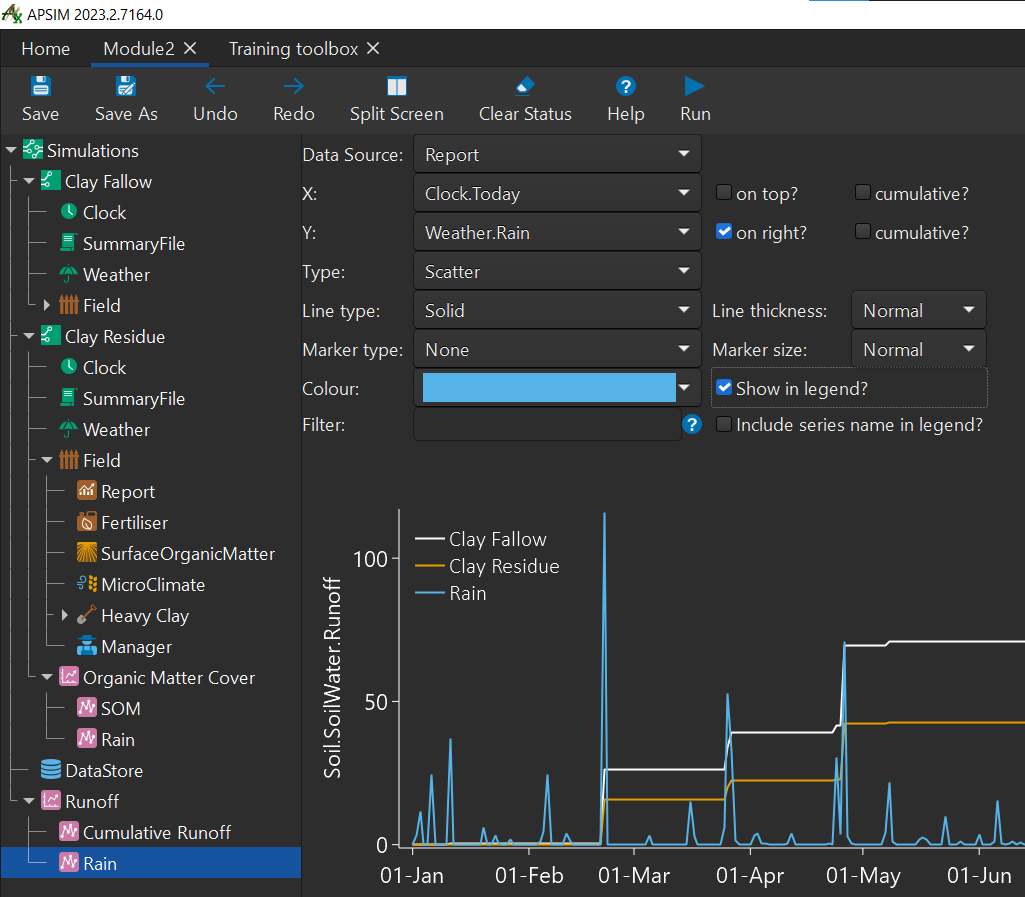
Let’s add another Series for
Rain- To do this:
- right-click
Runoff - click
Add model - double-click
Series - rename this series to
Rain - set the series variables to below:
- right-click
- To do this:
The effect of residue type on speed of decomposition
The APSIM residue model will decompose residues at differing rates according to the C:N ratio of the material. To demonstrate this we will reproduce the previous simulation but apply legume residues in the place of the wheat residues.
- Create another copy of the
Clay Residuesimulation. Rename it toClay Chickpea Residue. Remove the graph component.- Remove the [Weather].Rain Report Variable from the Report node in the ‘Clay Chickpea Residue’ simulation.
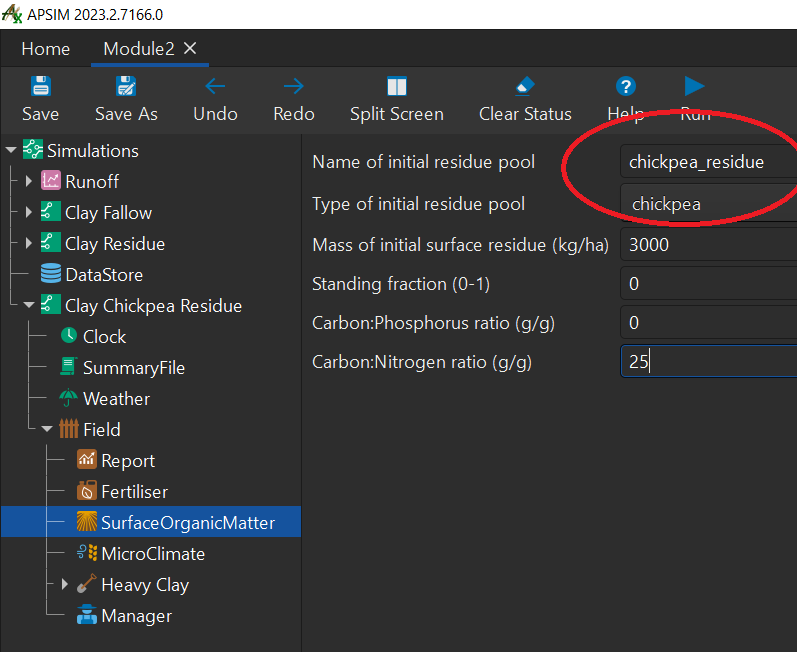
- Change the SurfaceOrganicMatter residue parameters to 3000 kg/ha of chickpea residue.
- Also change the initial residue pool to ‘chickpea’.
- Change the C:N ratio to 25.
- Run the simulation.
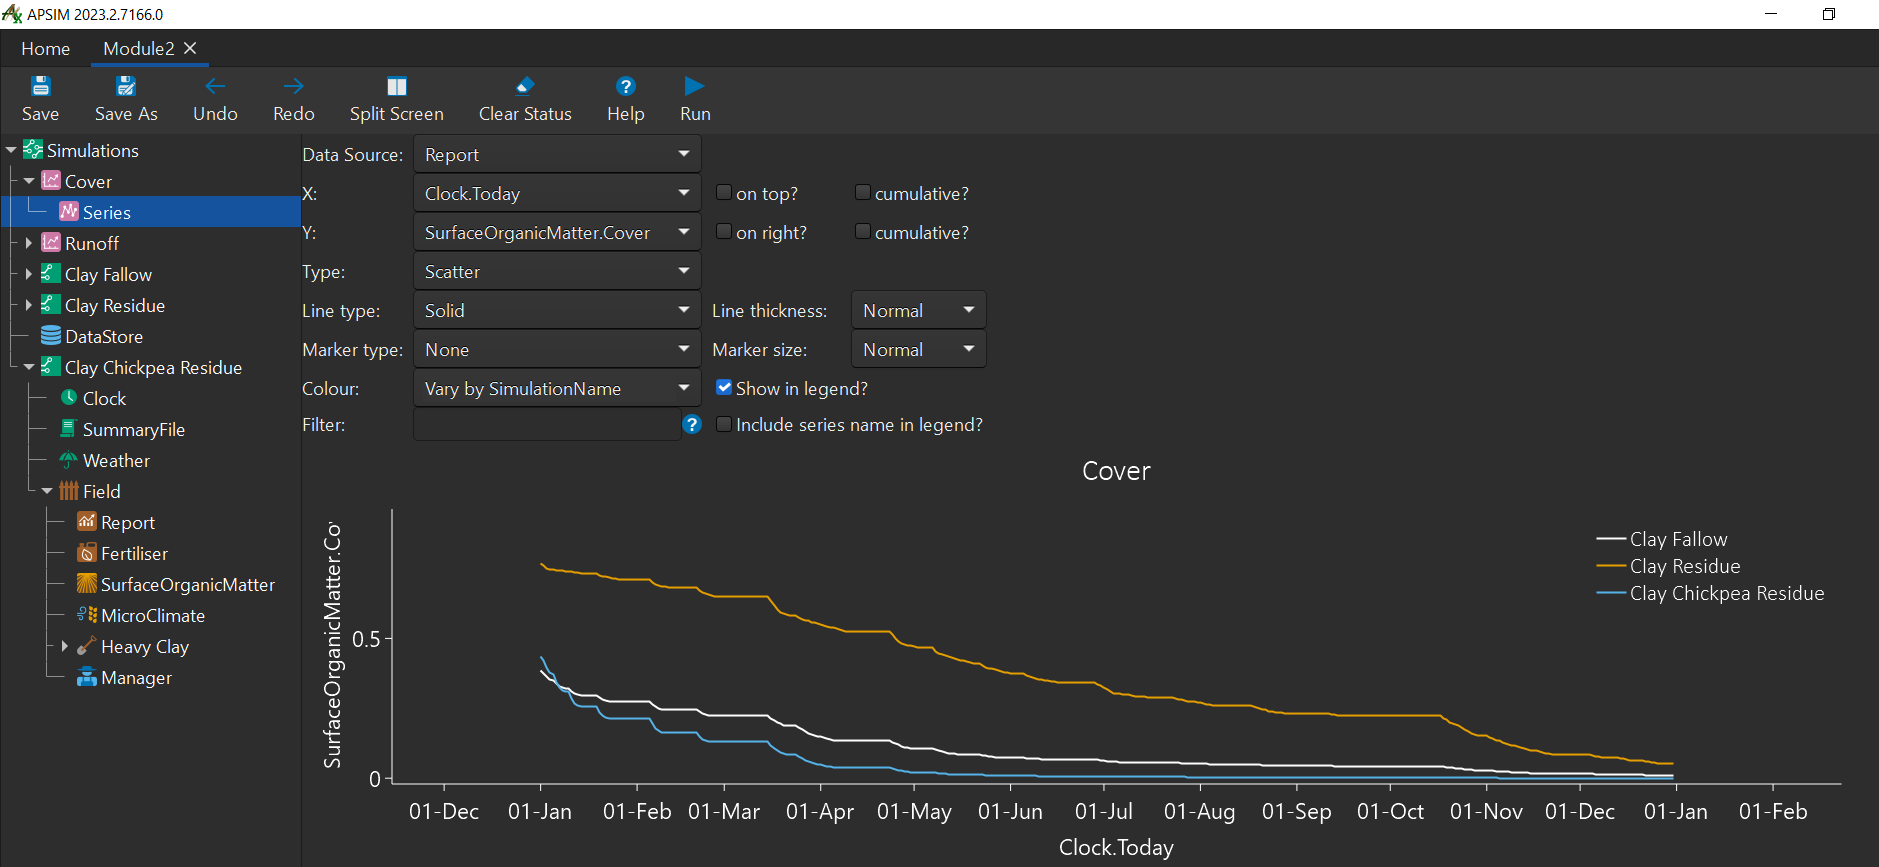
- Create a graph with all three residue simulations with residue as a function of time. Call the graph
Cover.- To do this:
- right-click the
simulationsnode - click
Add model... - double-click
Graph - rename
GraphtoCover - right-click
Covergraph - click
Add model... - double-click
Series
- right-click the
- To do this:
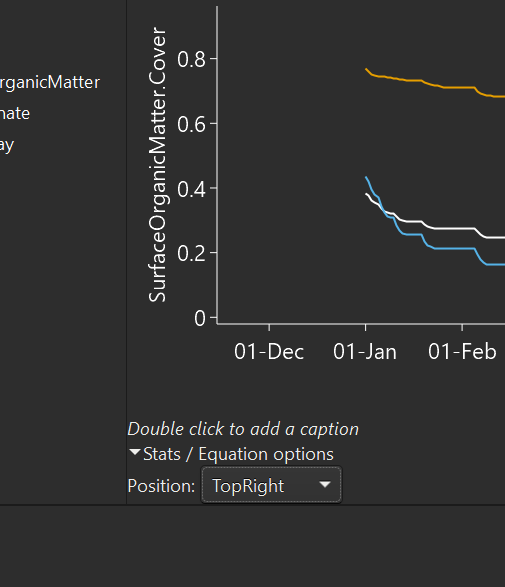
- Change the variables to match the image below:
- If you’d like the lengend to appear on the right of the graph like the image:
- Click one of the legend items
- a menu will appear at the bottom of the graph and you can change the drop down menu’s value to top right or any other position to your liking.
Congratulations on completing module two!
Note: If you found any incorrect/outdated information in this tutorial, please let us know on GitHub by submitting an issue.