Error Bars
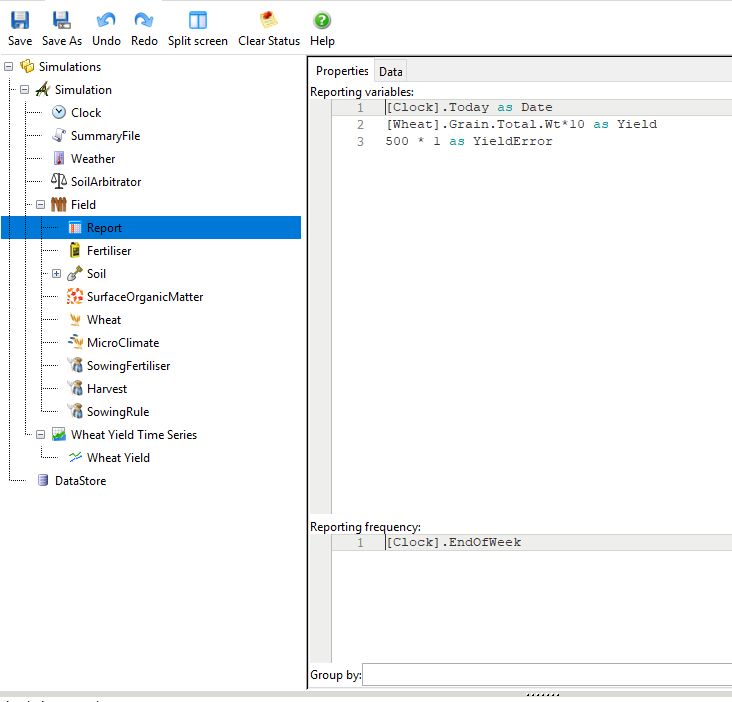
Error bars will automatically be added to a graph if an error column exists corresponding to the x or y data series. The error column must have the same name as the x or y series, with a suffix of “Error” (without the quotes). For example, if the y axis is displaying the Yield column, the error data must be in a column called YieldError. If using a PredictedObserved component, any error columns in the predicted or observed data will be automatically added to the PredictedObserved table.
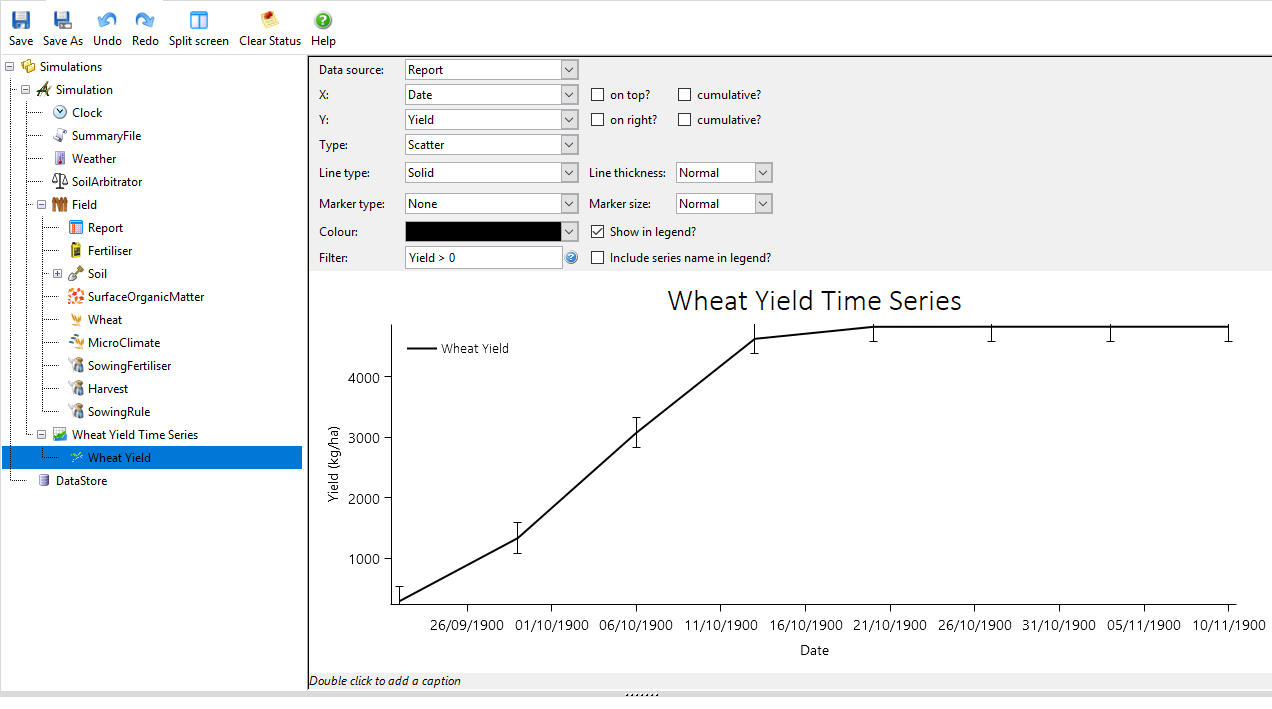
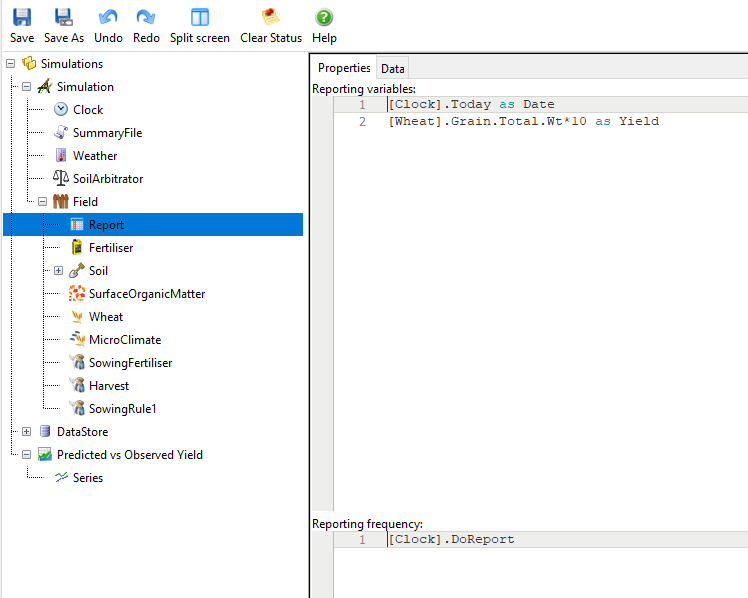
Simple Example
Report configuration
Resultant graph
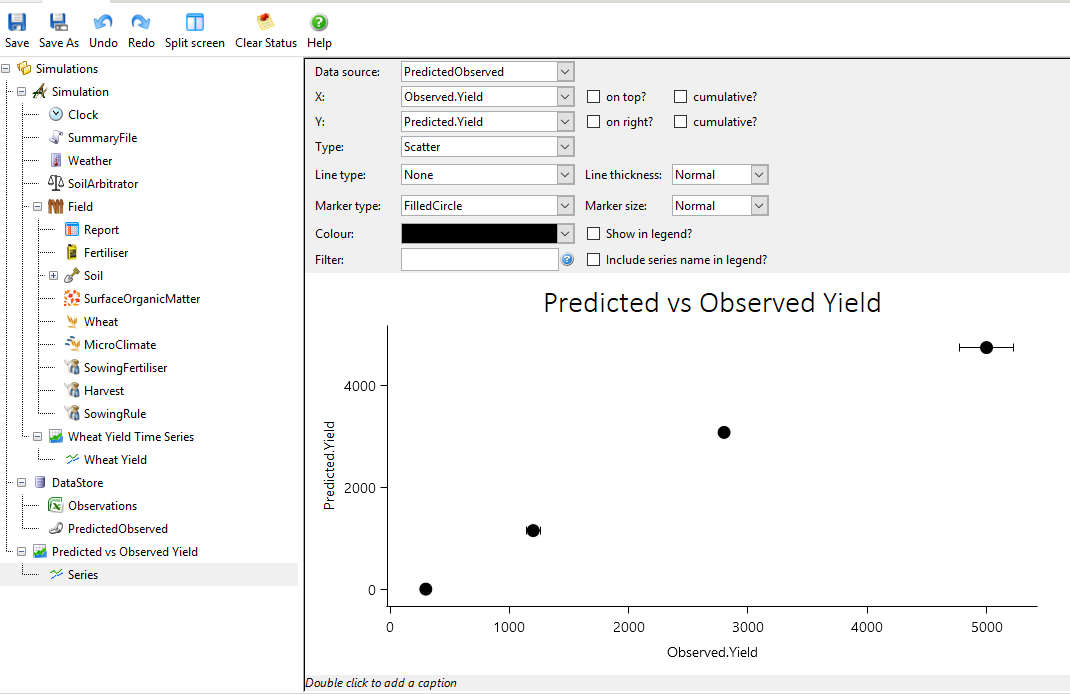
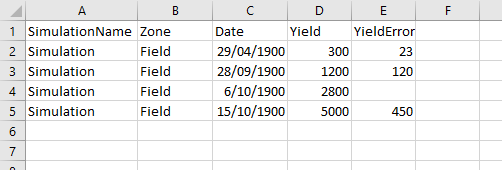
PredictedObserved Example
In this example, there is an error column in the observed data which will appear automatically on the graph. See here for full details on merging and graphing predicted/observed data.
Observed data
(Note that missing error values are fine.)
Report configuration
Resultant graph