Parameter Optimisation
APSIM provides access to several parameter optimisation algorithms from within the user interface. These function as a wrapper around the CroptimizR R package. For detailed questions regarding the optimiser or the R code it may be worth consulting the package’s documentation or bug tracker.
APSIM will by default run a CroptimizR simulation by using docker. This behaviour can be disabled by starting apsim with the environment variable APSIM_NO_DOCKER=1.
Requirements
Option 1: Docker (default)
- Docker must be installed
- If running windows, docker must be configured to run Linux containers
Option 2: Running R natively (not recommended)
- R version >= 4.0.0 must be installed. Binary installations are available for windows, macOS, and linux
- Rtools40 (only required on windows)
Once these requirements are in place, it is recommended to test the installation by running the example CroptimizRExample.apsimx file shipped with APSIM. This file should take 2-3 minutes to run on a modern laptop.
Configuration
Input file configuration
If using the docker runner (this is the default), all input files (ie .met, .xlsx, …) must be stored in the same directory as the .apsimx file. If the .apsimx file was generated by a script, care must be taken to ensure that the file paths are relative (not absolute).
Simulations Configuration
The simulations which are to be run by the optimiser must be children or descendants of the CroptimizR node. No other simulations in the file will be run by the optimiser.
Predicted/Observed data
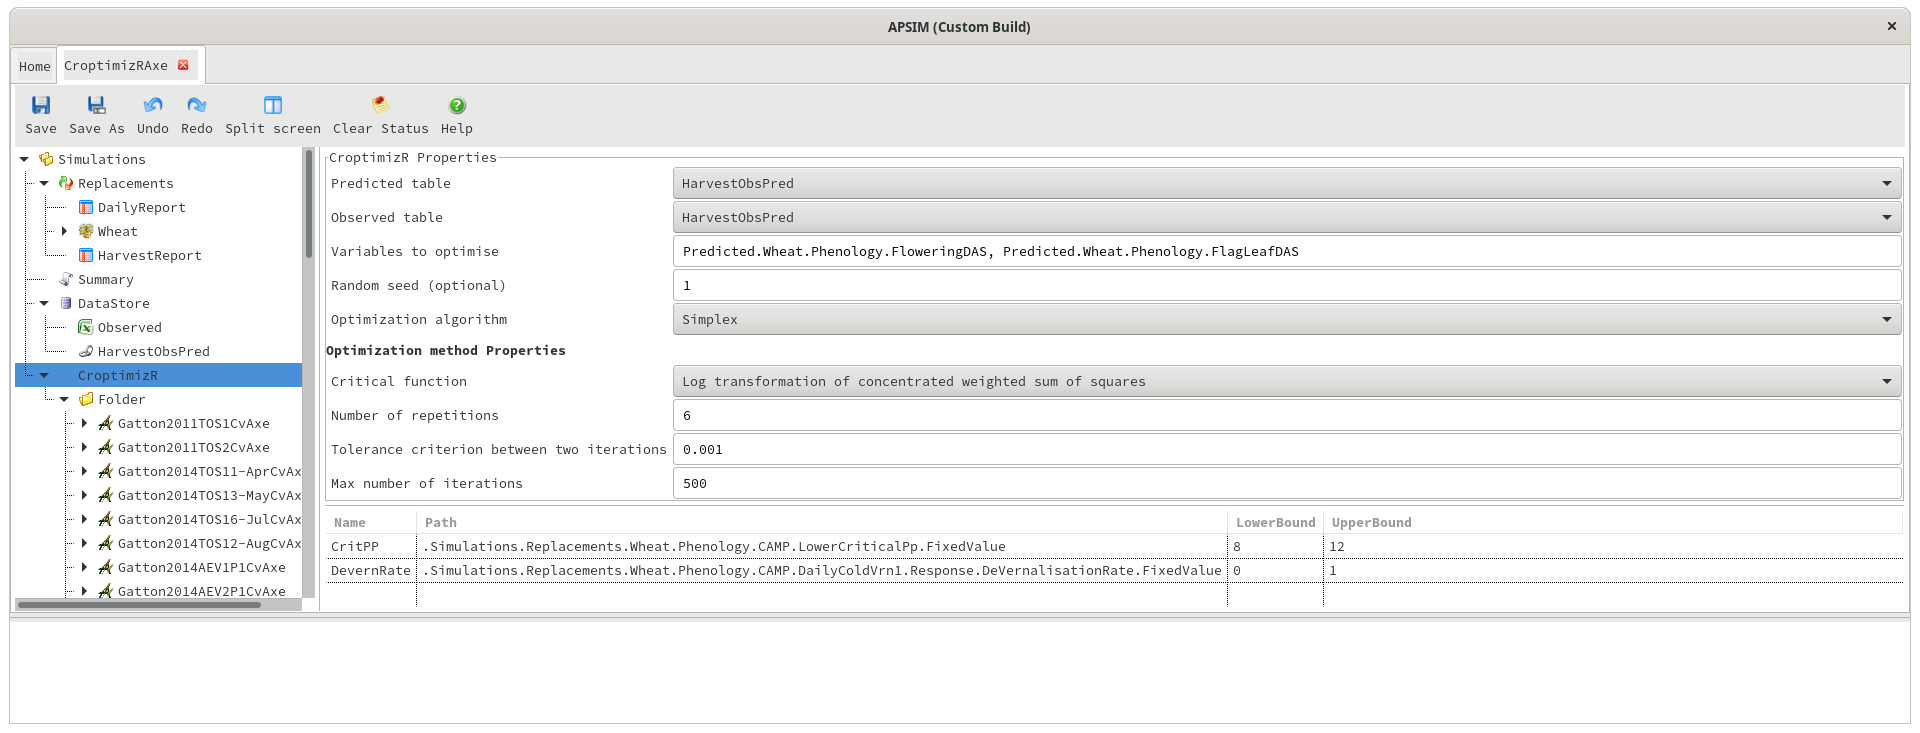
Predicted and observed data can exist in separate tables in the database, and if so, the optimiser will automatically attempt to merge the data on the date or Clock.Today column. This is easier to set up initially, but for more complicated scenarios (e.g. matching data on flowering or harvesting dates), it may be better to allow APSIM to merge the data by using a PredictedObserved table. When using this approach, the predicted and observed table names in the CroptimizR should be set to “PredictedObserved” (or whatever the PredictedObserved table is called - ie HarvestObsPred). When using a predicted/observed table, the variable names in the “Variables to optimise” section should be prefixed with “Predicted.”. For example, “Predicted.Wheat.Leaf.LAI” (without the quotes).
Other Parameters
Random seed
The random seed to be used by the optimiser. If left blank, the results of the optimisation will vary slightly between runs. If specified, it should be an integer and will cause the results returned by the optimiser to be identical if run multiple times.
Optimisation algorithm
Currently only simplex and bayesian algorithms are supported. For details on these algorithms, see this page in the CroptimizR documentation.
Critical Function
Several critical functions are offered by CroptimizR. For details, see this page.
Number of repetitions
The optimisation will be run multiple times, each time starting with different initial values for the estimated parameters. This parameter controls the number of repetitions.
Tolerance Criterion
Tolerance criterion between two iterations. Iterations will cease if the parameter values are changing by less than this amount.
Max number of iterations
The maximum number of iterations within a single repetition.
Example Configurations
Predicted and observed data in separate tables
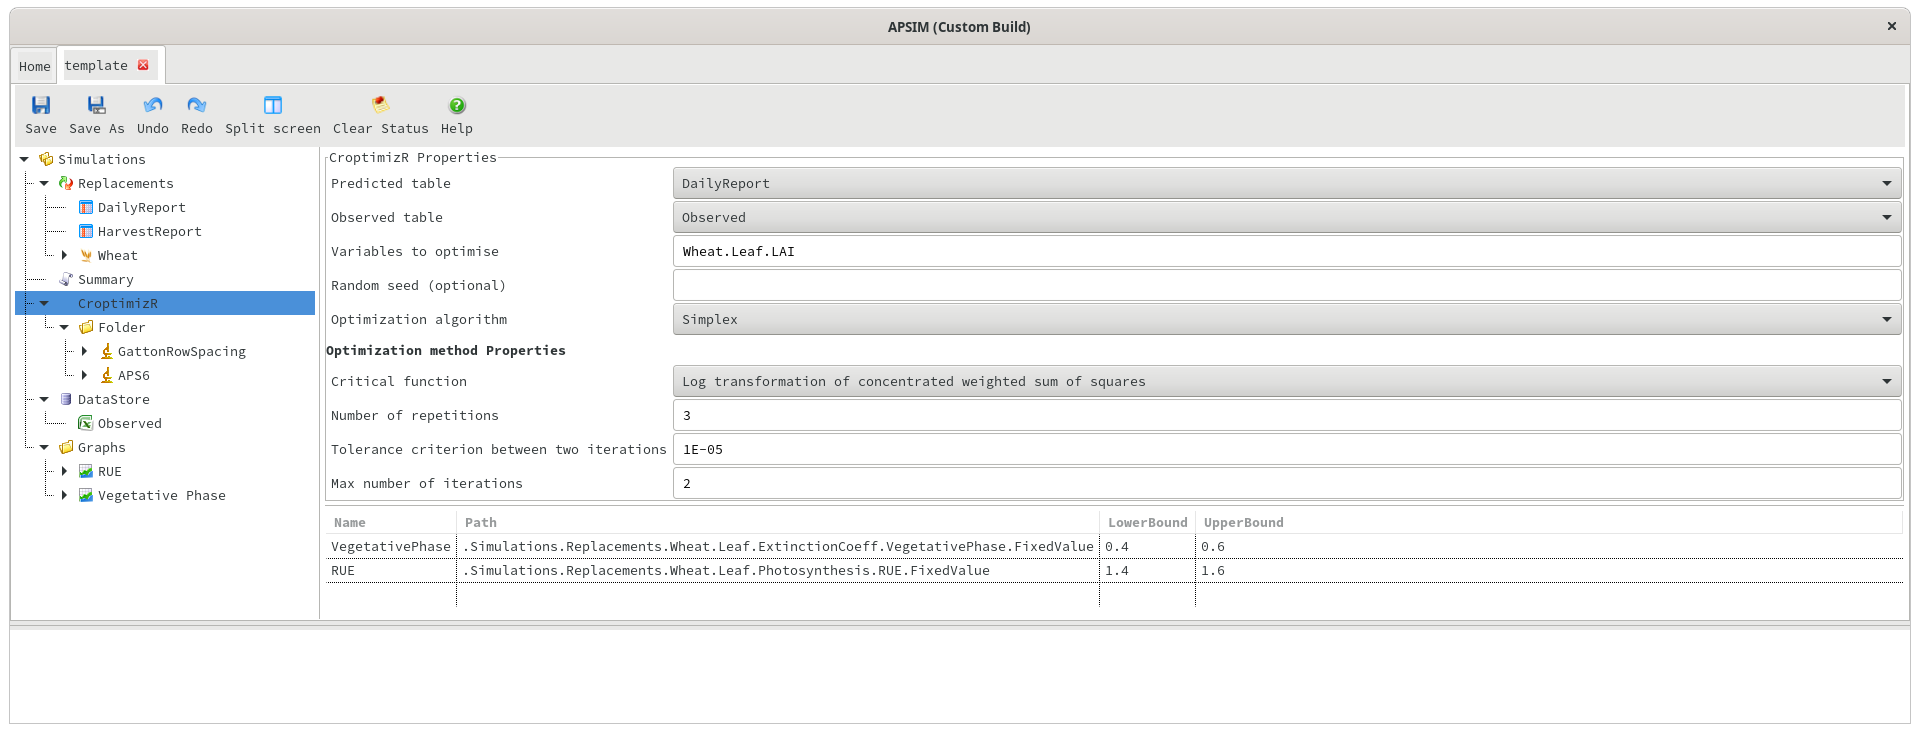
Predicted/Observed table
Outputs
If the optimisation fails for some reason, any errors will be written to the status panel in the user interface, so it should be immediately obvious if something didn’t work. Otherwise, a successful optimisation run will result in several outputs being generated:
External files
Two files will be generated in the same directory as the .apsimx file. These are optim_results.Rdata and EstimatedVSinit.pdf. The filenames will be prefixed with the name of the CroptimizR as specified in the user interface - so when using default settings, they will be called CroptimizR-optim_results.Rdata and CroptimizR-EstimatedVSinit.pdf. The .pdf file contains several graphs generated by the R code. The .Rdata file contains all of the relevant outputs of the optimisation run and can be opened and perused in R. They are also automatically imported into the database associated with the .apsimx file, so they can be graphed or viewed from inside APSIM.
Summary file
If the .apsimx file contains a top-level summary node (as in the examples above), then all console output generated by the optimisation will be written to the summary file (accessible by selecting CroptimizR from the simulation name dropdown). This will contain some basic info about the run - it’s useful for checking that the run was successful but not much more.
Datastore
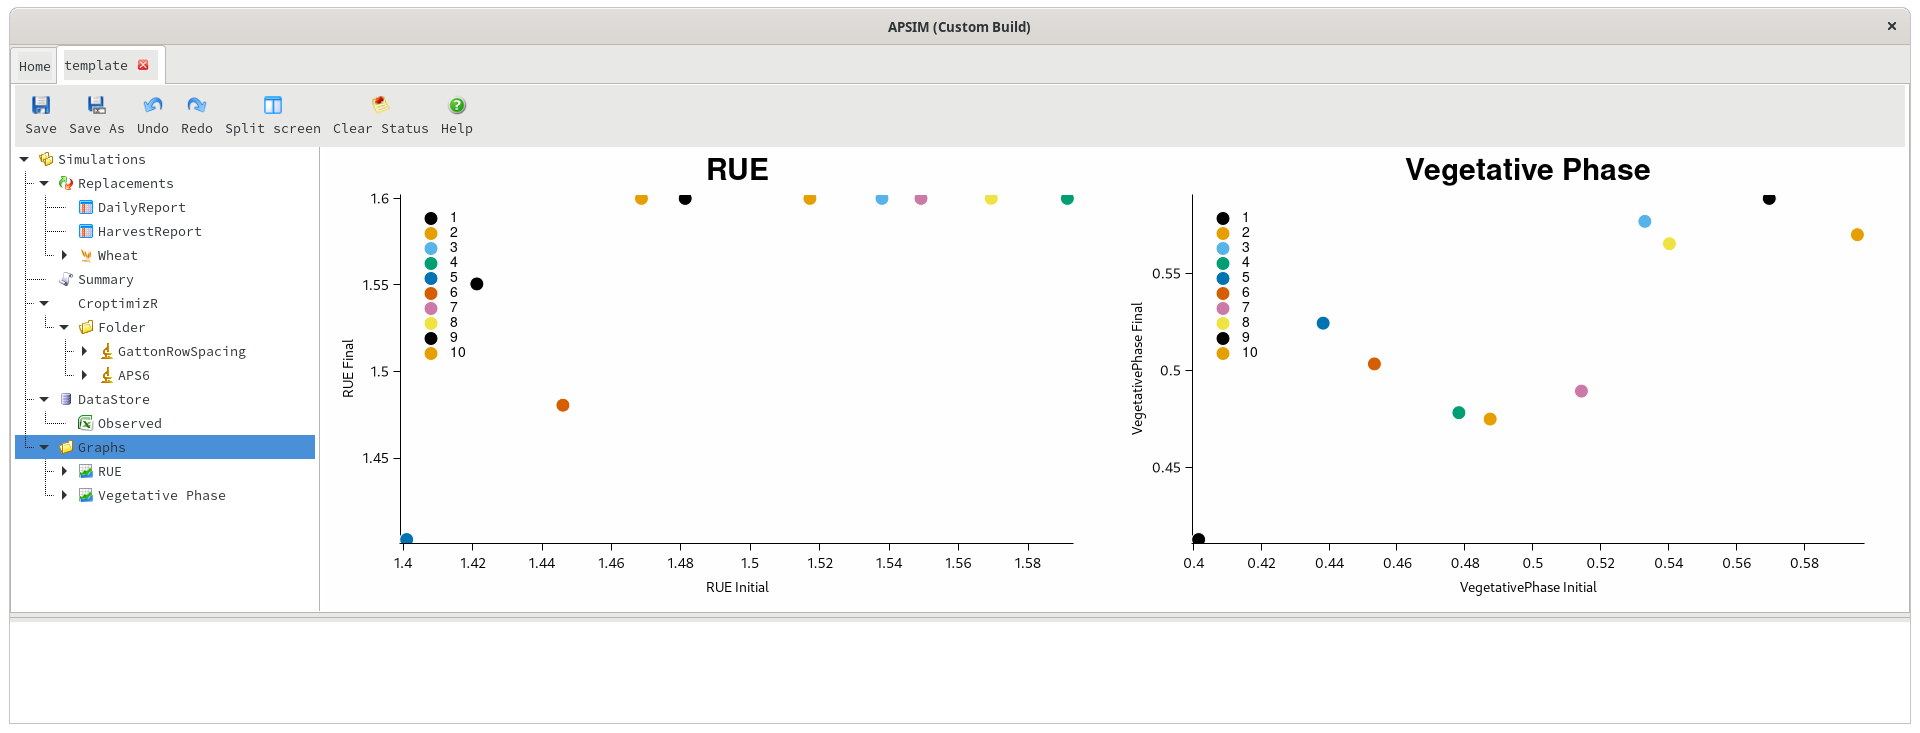
As mentioned earlier, the detailed outputs of the optimisation are imported into the datastore, and can be viewed by clicking on the datastore and choosing CroptimizR from the simulation name dropdown. This data shows one row per repetition of the optimisation, and can be graphed inside APSIM.
Starting vs optimal value in each iteration