Module 4: Sowing A Crop
Created 23/02/2023 - Last updated 05/03/2023
IMPORTANT NOTE: It is highly recommended that you upgrade your APSIM Next Gen version to at least version 2023.2.7164.0 or later.
Sowing A Crop
In this exercise you will observe the growth of a crop over a single season. You will learn a bit more about how to use APSIM to do a ‘what-if’ experiment with fertiliser rates. These skills can not only be used to experiment with sowing fertiliser rates but also variables such as:
- Time of planting.
- Rate of sowing.
- Crop comparisons and different starting soil moisture conditions.
- Start a new simulation using the
Wheat.apsimxexample.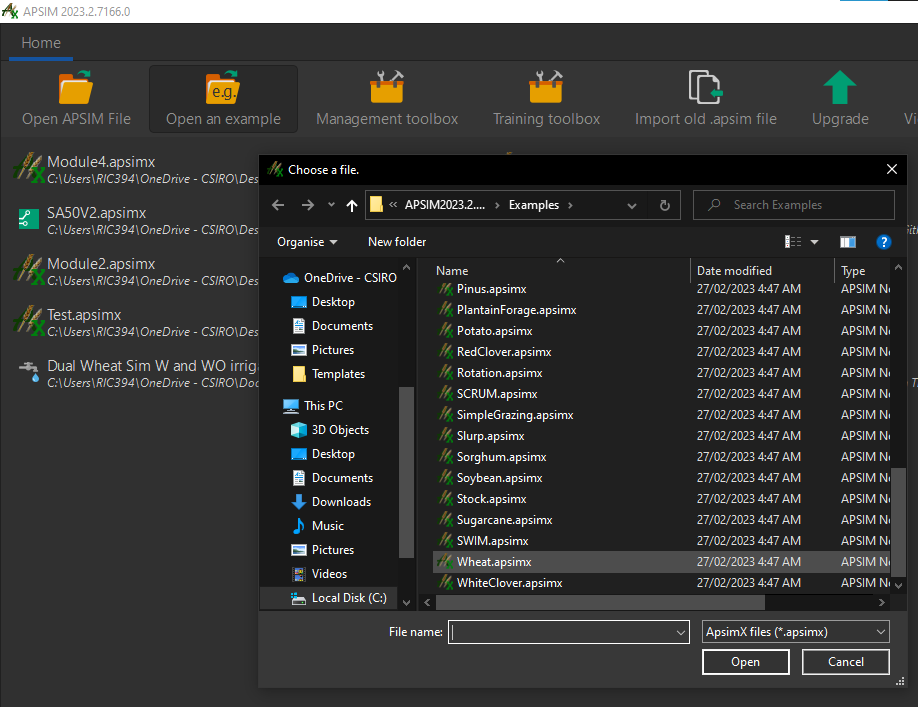
- you can find this in the
open an examplemenu item
- you can find this in the
- Rename the simulation as
Wheat. - Save this simulation as
Module4.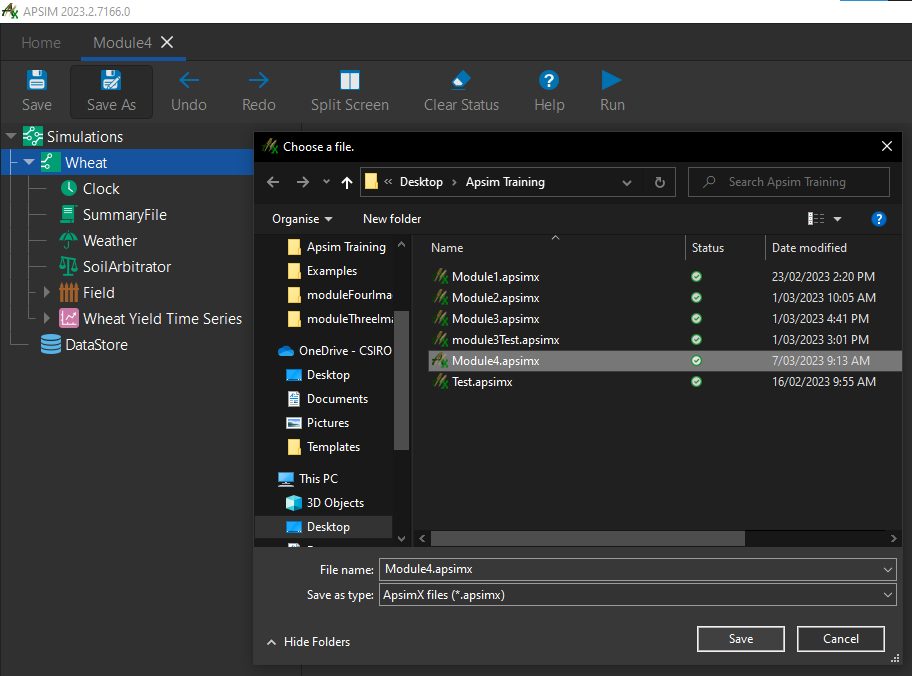
- Make sure that
AU_Dalby.metis the selected met file under the weather node. - Set the start and end dates of the simulation as
1/01/1989 - 31/12/1989under theClocknode.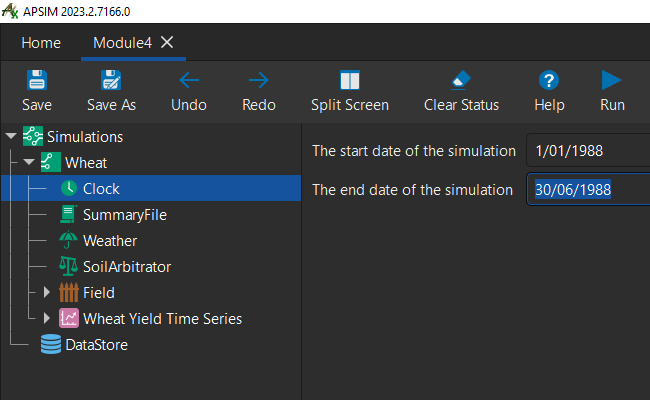
- Set the starting water to 25% full - filled from top. This is under
SoilthenWater.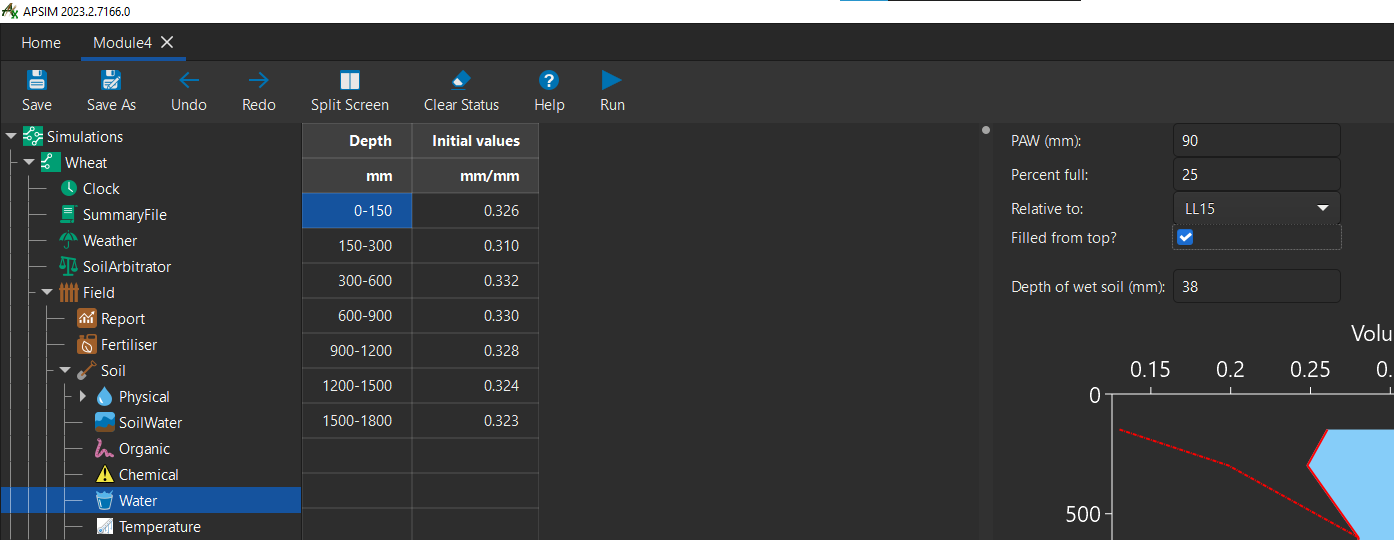
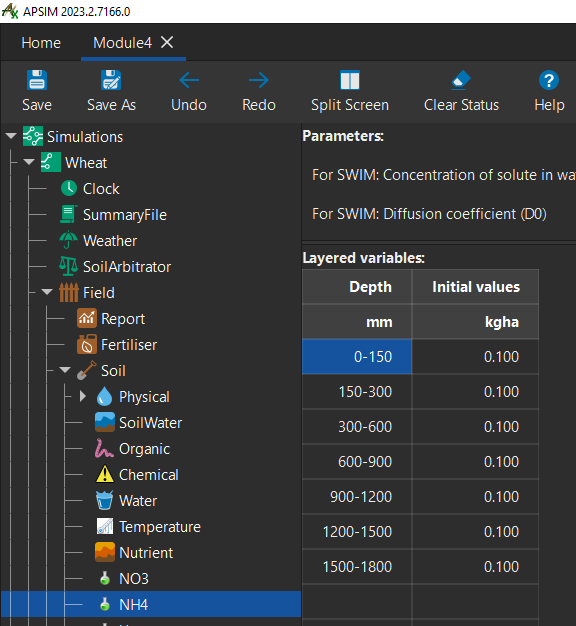
- Set the
initial valuescolumn of bothNO3andNH4tokg/ha.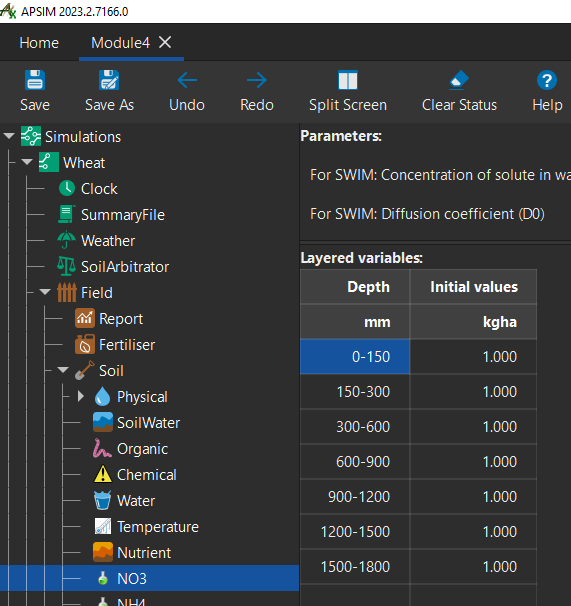
- Now let’s make some changes to the
Fertilise at sowingmanagement node. - Change the
Fertilise at sowingparameterAmount of fertiliser to be applied (kg/ha)to0: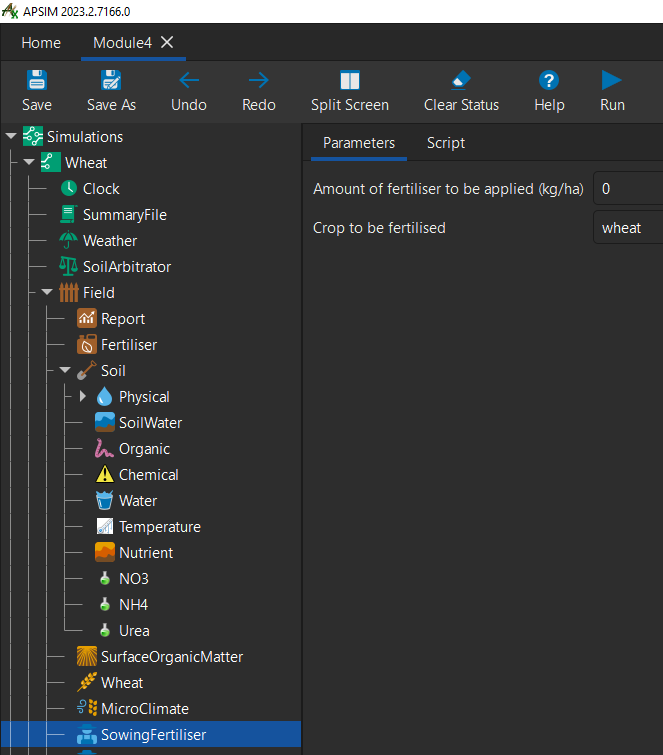
- Let’s run the simulation and then inspect the
Graphgraph. - Make sure the x and y axes are set to
Clock.TodayandYieldrespectively. - Rename the graph to
Wheat Yield Time Seriesand its’SeriestoWheat Yield.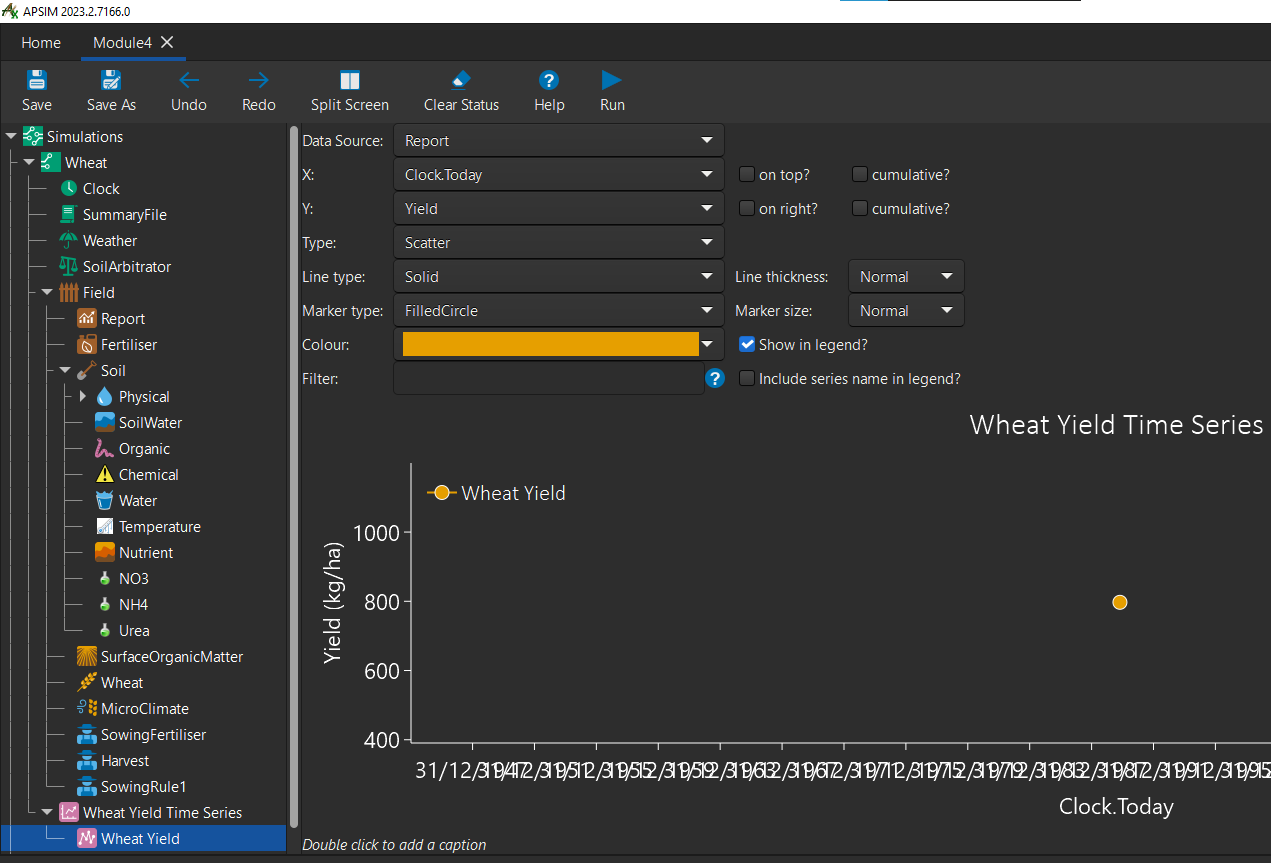
- We can see with 0 sowing fertiliser we achieved a yield of almost 900 kg/ha.
- Next we will create an experiment where we alter the sowing fertiliser amount for this year. We will see how this affects the yield.
Creating an experiment
- First add a
Experimentnode to theSimulationsnode at the top of the simulations tree.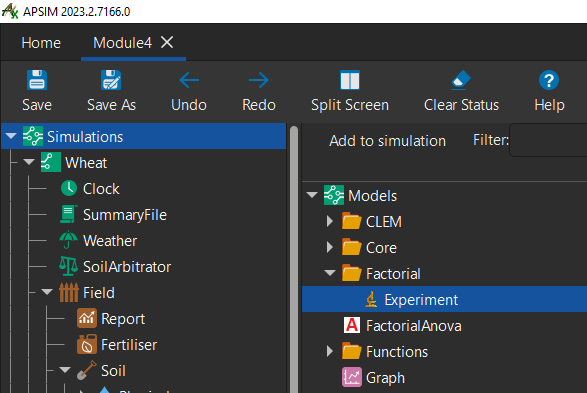
- The
Experimentnode will be added to the bottom of the tree, holdctrlkey and pressup arrowseveral times until it is directly below theSimulationsnode. - Add a
Factorsnode to this experiment.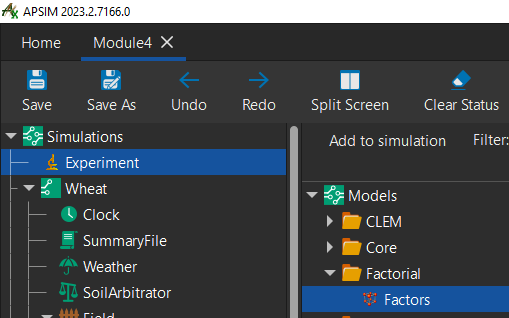
- Add a
Factornode to theFactorsnode.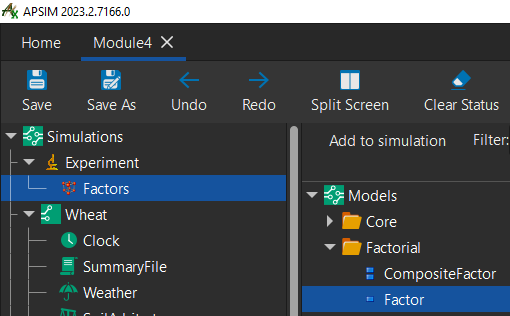
- To be able to change factors in our experiment, we will have to add our
Wheatsimulation to the experiment as a child node. - Drag and drop the
Wheatsimulation node onto theExperimentnode.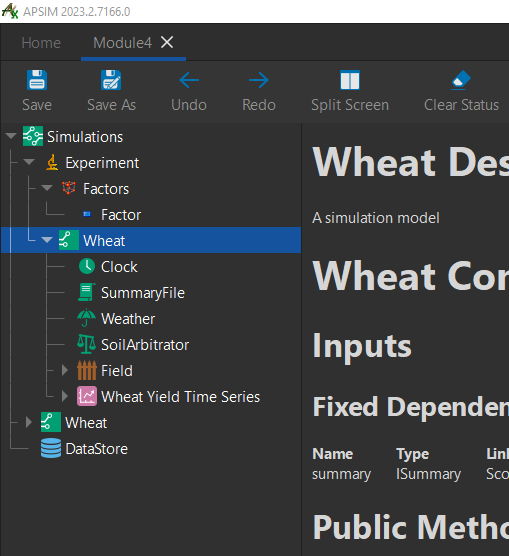
- Delete the
Wheatsimulation that is not a child of the experiment node.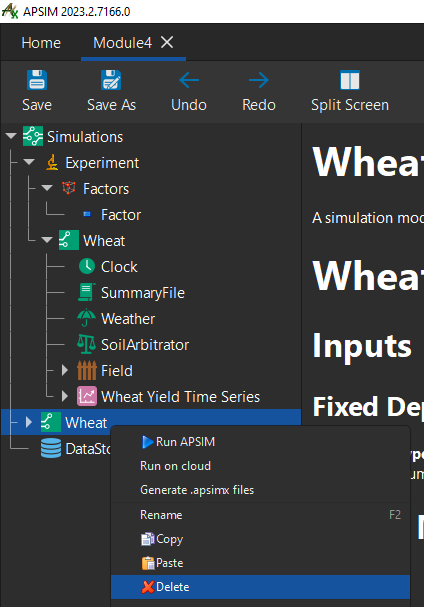
- Next, we will create several versions of our experiment with varying sowing fertiliser amounts.
- To do this, add this line to the
Factornode:[Fertilise at sowing].Script.Amount = 0 to 60 step 30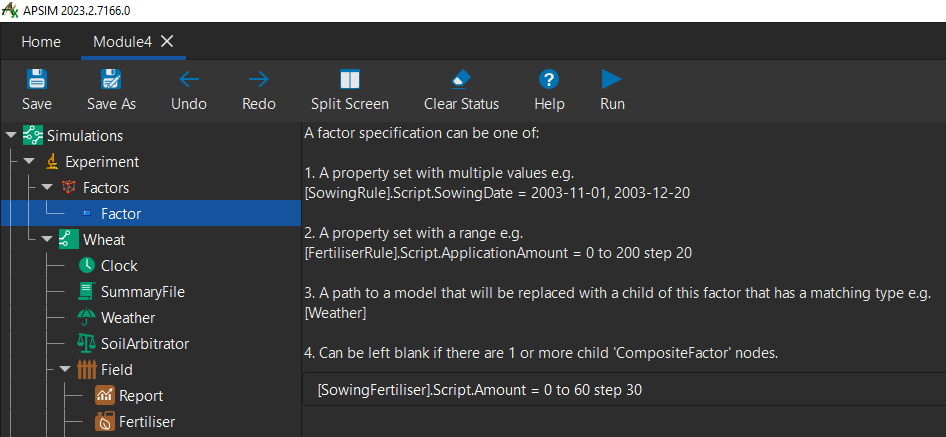
- If we click back on the
Experimentnode, you can see 3 differing amounts of sowing fertiliser.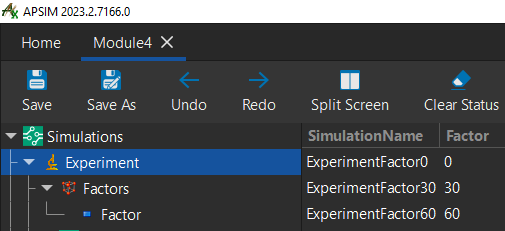
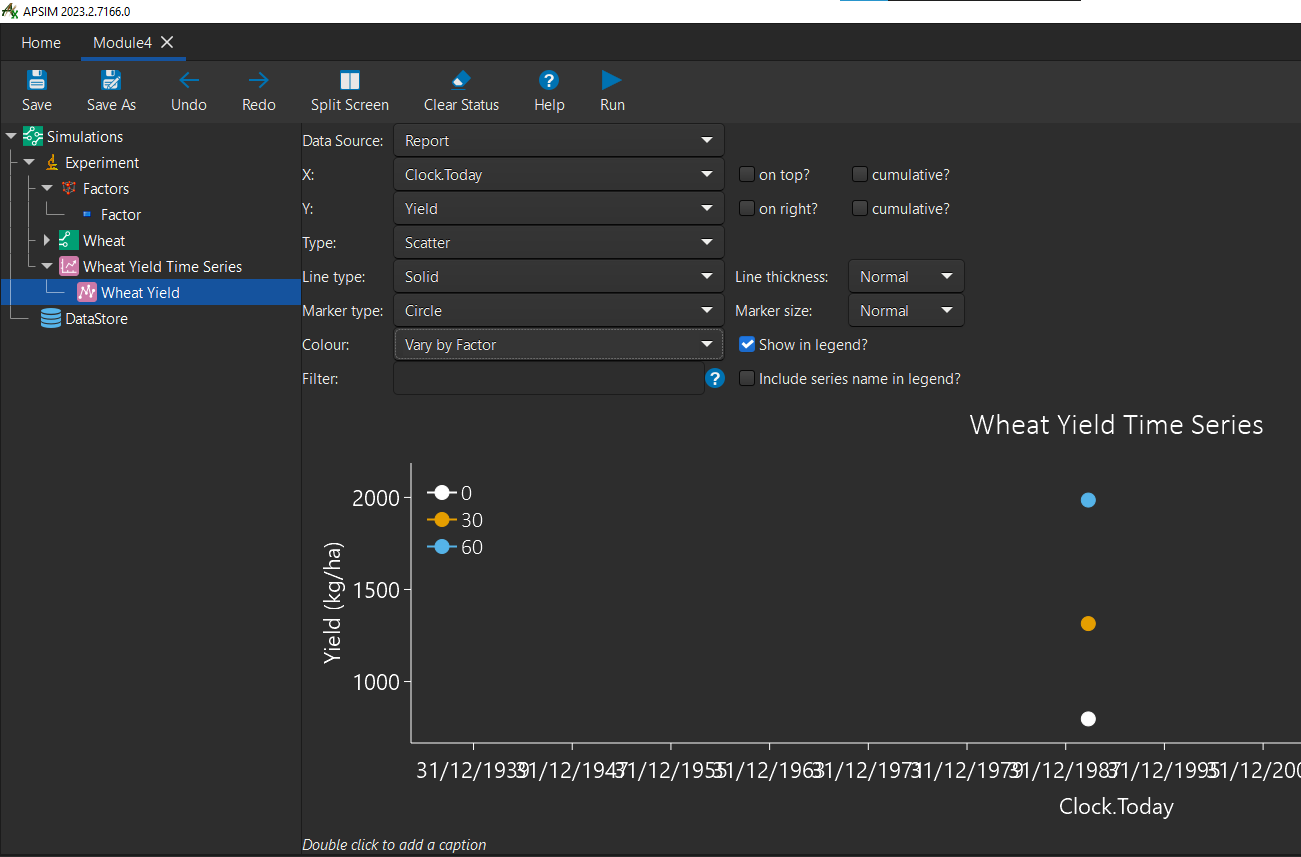
- To see the results lets drag a copy of the
Wheat Yield Time Seriesgraph onto theExperimentnode. Change the variables to reflect the image below: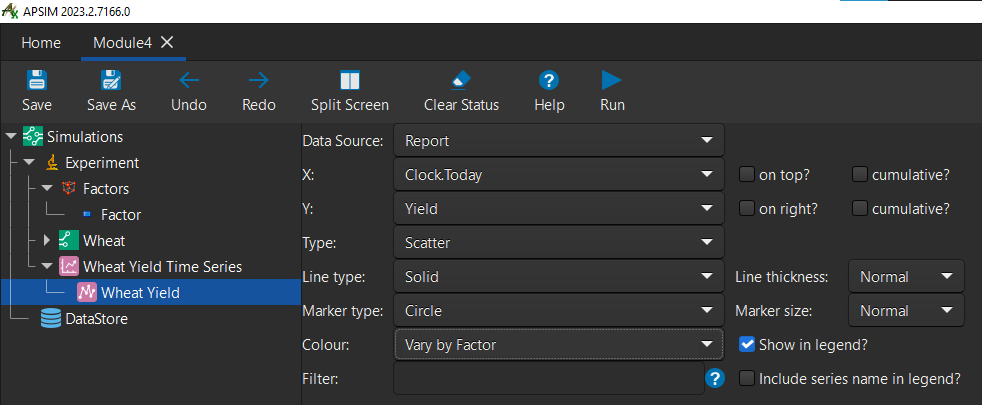
- Run the simulation. You’ll see that the sowing fertiliser amounts increase the yield of the wheat crop by varying degrees.
Congratulations on completing the 4th module
Note: If you found any incorrect/outdated information in this tutorial, please let us know on GitHub by submitting an issue.